The following document was written by Mr Vik Veer MBBS(lond) MRCS(eng) DoHNS(eng) in Dec 2007. You may use the information here for personal use but if you intend to publish or present it, you must clearly credit the author and www.clinicaljunior.com
This site is not intended to be used by people who are not medically trained. Anyone using this site does so at their own risk and he/she assumes any and all liability. ALWAYS ASK YOUR SENIOR IF YOU ARE UNSURE ABOUT A PROCEDURE. NEVER CONDUCT A PROCEDURE YOU ARE UNSURE ABOUT.
The Complete Basics of ECG Interpretation
This document is for doctors, nurses or medical students who have forgotten (or never really understood) ECGs. I’m not going to go into the ins and outs of ECG – just a guide to help you work out if the person in front of you is having a major cardiac event or not. I guess it will help house officers (FY1’s) who are suddenly faced with an ECG on the ward and also new A&E SHO’s who are continually asked to read ECGs for random people around the department. I have written this assuming some basic understanding of medicine and ECG's - if something really doesn't make sense please contact me.
So to start off with it’s a good idea to understand the layout of the ECG. Most departments use the following format below.
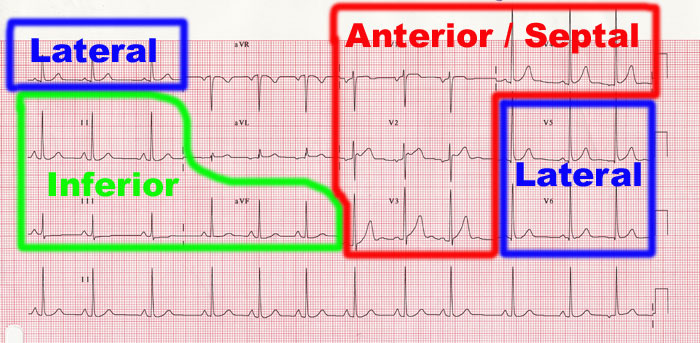
As you can see there are a few heart beats for each of the ‘leads’, such as lead I, II, III, V1, V2 etc. Each of these leads show the electrical activity in the heart viewed from a different angle. Our job is to interpret all these leads as a whole. One lead only tells the story from that angle – to understand what is going on you need to see it from all sides.
Different areas of this ECG describe different areas of the heart. As you can see there is are ‘inferior’, ‘anterior’, ‘septal’, and ‘lateral’ sections that we need to remember. Don’t worry about where these are exactly on the heart – knowing what they are called is enough for you to explain what you are talking about to the medical registrar on the phone.
Before we move on just to remind you about the ECG wave or complex - and what it means.
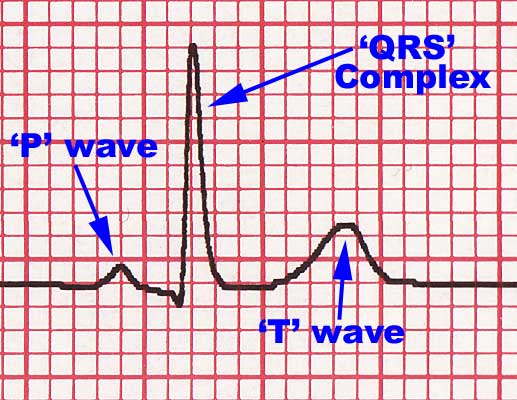
The p wave which corresponds to the atria contracting and then the QRS complex which is the ventricles contracting. The T wave is the just the ventricles relaxing.
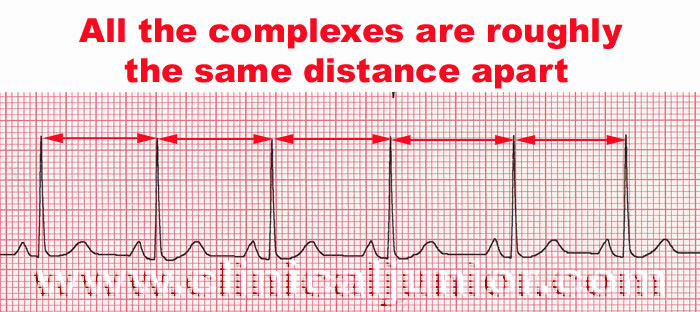
At the bottom of the ECG printout (see first ECG) there is a long section with the heart beat shown all the way across the page. This is mainly used to work out the ‘rhythm’ i.e. if the patient as an irregular heart beat or not. What you do is look for the QRS complexes and then compare the distance between the complexes. If you look below at the first ECG you can see the QRS complexes are pretty much evenly spread apart (there are small changes in this distance with breathing which slows and speeds up the heart rate very slightly)
Now look at the ECG below you see I’ve highlighted the peaks of the complexes and you can see obvious differences in the spaces between the complexes. The ECG below is a good example of an irregular heart rhythm. The most common cause for an irregular heart rhythm is atrial fibrillation or AF.
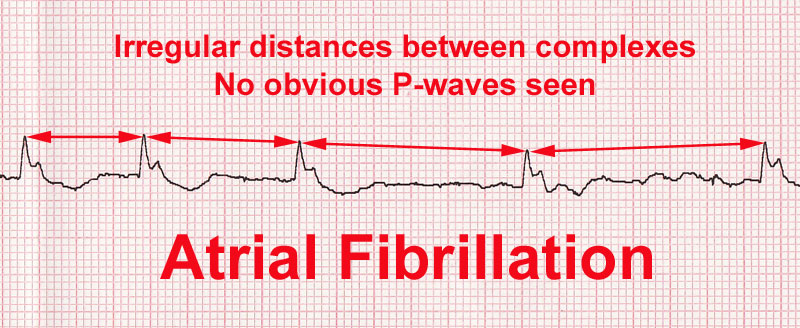
AF is when the atria have lost their ability to beat and contract in an organised well mannered way. Instead they randomly fire off and apparently it looks like a ‘bag of worms’ rather than a healthy pumping action. This random firing of the atria leads to a random heart beat. So to diagnosis AF you see an irregular heart beat and loss of the ‘P’ waves. If the patient goes into AF you won’t see any p waves at all.
In all the books I’m sure they go on about the calculating the rate and the axis etc. The object of this document is just to help you work out if the patient is in real trouble.
Looking for Ischaemia / Angina on an ECG
Obviously the thing to remember here is that a good history and examination is vital here - the ECG is useful but can be completely normal in someone with terrible real angina. So bear this in mind before you read on...
If possible try and get an ECG done previously when the patient isn’t having chest pain so you can see any differences which can be more useful than one ECG by itself.
The main area to look for is the ‘ST’ segment, which is just the flat area between the QRS and the T wave. The ST segment should be at the same level as the rest of the flat sections of the ECG trace – or the baseline. In ischaemia the ST segment sinks lower than the baseline, otherwise known as ST depression.
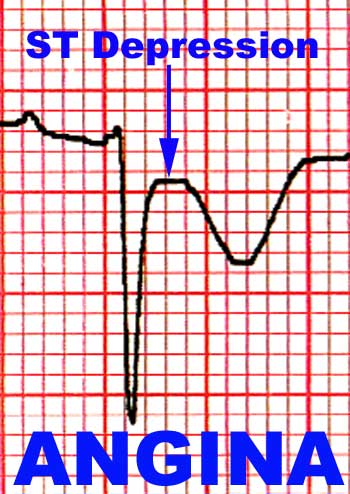
The other thing you can see on the angina ECG above is that the T wave (the last wave) is upside down. T wave inversion or even flattening is another sign of angina, but it is not a good one. It could also signify an old or current heart attack (myocardial infarction). But clues like this are useful when you become more experienced and you are trying to interpret more difficult ECG’s.
There are some things you should bear in mind before you can say if the patient really has angina or not.
- ECGs aren't fool proof - if you are convinced that the patient has angina from the history but the ECG is normal then you should still contact someone senior. ECGs can be normal when really something awful is happening.
- You occasionally get random complexes popping up (called 'ectopics'). They look completely different from the rest of the ECG. Don't try and interpret these single complexes if all the others around it are normal.
- You also need to see ST depression in 2 or more consecutive leads to confidently say if this is a case of angina or not. These 2 leads tend to be in the areas i've highlighted in the first ECG at the top of the page - however remember they can occur anywhere.
- The most important thing is seeing a change in the ECG – doing repeated ECGs are more useful than one static image. A ‘dynamic’ changing ECG is much better evidence than a single bad looking ECG.
- Try giving the patient GTN spray / tablets under the tongue and then repeating the ECG – seeing a improvement in the ECG (normalising of the ST segment) is also good evidence of angina – plus you have treated the patient as well. Don’t do this however unless you are almost sure that the patient has angina as GTN can give quite bad headaches and drops in BP.
- T wave flattening or inversion can occur anywhere on the ECG however again you need to see it on two or more consecutive leads (not including aVR) for you to get worried about it. Remember the the history and a change on the ECG is more important than a ECG by itself.
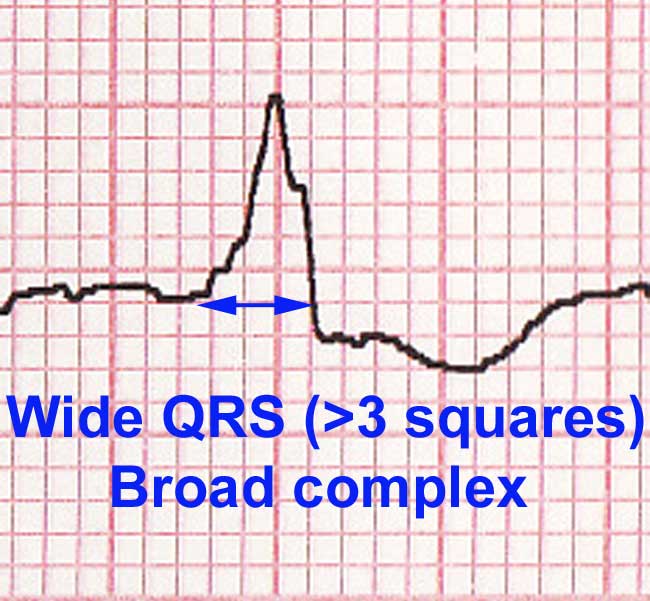
- If the patient has a broad QRS complex then you are not able to interpret the ST segment. This messes up the whole thing and makes it more difficult to interpret. However a good history and / or change on the ECG is important, and so discuss with someone who knows more if you see this. I will talk about broad QRS complexes another time – a good example of this is the image below showing a wide (greater than 3 small squares) QRS. Therefore even though it looks like ST depression you can't really comment on this area because of the wide QRS
Infarction
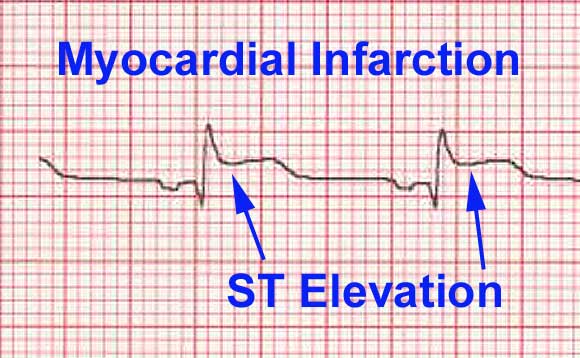
If you are looking for evidence of infarction of the heart then you need to look at the same ST segment again. This time however you are looking for ST ‘elevation’. As you can see below (ECG section taken from Wikipedia) there is an elevation of the ST segment.
There are some things you should bear in mind before you can say if the patient really has infarcted some cardiac muscle or not.
- Infarction can occur anywhere in the heart and therefore anywhere on the ECG. If you were to see ST elevation associated with MI you would see it commonly in the anterio-septal or the inferior regions of the ECG (see again at the first ECG at the red and green areas), although it can be anywhere and even everywhere on the ECG. The shaded areas are just areas where you see infarcts more commonly than not.
- You occasionally get random complexes popping up (called 'ectopics'). They look completely different from the rest of the ECG. Don't try and interpret these single complexes if all the others around it are normal.
- You probably also need to see ST elevation in 2 or more consecutive leads to confidently say if this is a case of infarction or not.
- The most important thing is seeing a change in the ECG – doing repeated ECGs are more useful than one static image. Seeing an ECG before any chest pain is invaluable in working out if the ST elevation seen is an actual infarction or not.
- As before If the patient has a broad QRS complex then you will find it much harder to interpret the ST segment (see section on ST depression). Fall back on your history and examination and other pointers.
- There are rules governing whether or not the ST elevation seen is significant or not. If you look closely at the ECG above you can see that the ST segment has ‘risen’ about 1.5 small red squares above the baseline. In actual fact this would only be considered ST elevation if it were seen in the inferior leads as you need greater than one small square elevation for it to be considered significant. If the ST elevation is seen in the limb leads (V1-V6 or the right half of the ECG) then you actually need 2 small red squares elevation for it to be considered significant.
- I wouldn’t wait around for an ECG to become 'significant' before you call your senior. If you can see a change in the ECG and things are gradually getting worse and worse – you should call a senior urgently for further advice.
There are more scary ECG’s out there like ventricular tachycardia and also ventricular fibrillation.
These are always easy to see and nearly always are in a patient who look like they are about to die. In these situations if the patient looks very unwell - you should call the crash team and get someone more experienced to save the patient. I would advise you to attend a resuscitation course to know what to do in this situation.
Depending on the response I get from this document I will consider doing a more in-depth review of ECG interpretation – this is only meant to be a guide for the completely lost and/or scared. if there are any inaccuracies or would like more information – please email me using the contacts section.
Further Reading
The Alan E. Lindsay ECG Learning Centre
Ken Grauer, M.D. 12 lead ECGs a ‘brain web’
EKG World Encyclopedia